In today’s competitive job market, simply listing “proficient in Excel” on your resume is no longer enough. Employers across virtually every industry are seeking candidates who can not only use spreadsheets but can extract insights from data, tell compelling stories, and drive informed decisions. This demand has made Data Analysis Projects Excel a critical differentiator, even for roles that aren’t explicitly data-focused. For job seekers, showcasing these abilities through practical Excel-based data analysis projects is key to standing out. This is where well-executed data analysis projects using Excel for job applications can truly propel your career forward.
This comprehensive guide will delve into the power of using Excel for data analysis projects, specifically tailored to enhance your job applications. We’ll explore what makes a project impactful, provide compelling data analysis projects Excel, and equip you with the essential skills and best practices to create a portfolio that grabs recruiters’ attention. Our aim is to provide you with a clear roadmap to demonstrate your analytical prowess, boost your confidence, and secure your next career opportunity.
- What are Data Analysis Projects with Excel for Job Applications?
- Why Data Analysis Projects Excel Job Applications Matter
- Key Excel Skills for Data Analysis Projects
- Real-Life Excel Data Analysis Examples for Job Applications
- Comparison: Excel vs. Specialized Data Tools for Job Applications
- Common Mistakes in Presenting Excel Data Analysis Projects
- Expert Tips and Best Practices for Impactful Data Analysis Projects Excel Job Applications
- FAQ Section
- Q: Where can I find datasets for data analysis projects Excel job applications?
- Q: How many projects should I include in my portfolio?
- Q: Should I share the actual Excel file?
- Q: Can I use publicly available Excel data analysis examples as my project?
- Q: How do I explain my project in an interview?
- Q: Is Excel still relevant for data analysis in 2025?
- Q: How can I ensure my project is unique?
- Conclusion
What are Data Analysis Projects with Excel for Job Applications?
Data Analysis Projects Excel for job applications are practical exercises where you use Microsoft Excel to collect, clean, analyze, and visualize data to answer a specific question or solve a problem. These Excel-based data analysis projects serve as tangible proof of your analytical capabilities, going beyond theory to show real-world application and highlight your skills in handling data analysis projects using Excel tools effectively.
Unlike academic exercises, these projects are designed to be concise, impactful, and directly relevant to the types of data challenges employers face. They allow you to showcase your proficiency in Excel’s powerful features, your ability to think critically, and your skill in translating complex data into actionable insights. For job seekers, including these data analysis projects Excel job applications is a strategic move to differentiate themselves in a data-driven hiring landscape.

Why Data Analysis Projects Excel Job Applications Matter
Including compelling Data Analysis Projects Excel in your job application strategy offers significant advantages in today’s competitive market. Well-structured Excel data analysis projects can showcase practical problem-solving skills, while diverse data analysis projects using Excel demonstrate adaptability and depth in handling real-world business challenges.
Demonstrate Practical Skills
Anyone can claim Excel proficiency, but a well-executed project *shows* it. It provides tangible evidence of your ability to manipulate data, apply formulas, create pivot tables, and visualize findings. This practical demonstration is far more convincing to a hiring manager than a simple bullet point on a resume.
Showcase Problem-Solving Abilities
Data analysis isn’t just about crunching numbers; it’s about solving problems. A project demonstrates your ability to identify a question, find relevant data, analyze it, and derive meaningful conclusions. This highlights critical thinking and problem-solving skills, which are highly valued by employers across all industries.
Stand Out from the Crowd
While many applicants might list Excel, far fewer present actual projects. By including data analysis projects Excel job applications, you immediately differentiate yourself, signaling a proactive, results-oriented mindset. It shows initiative and a genuine interest in leveraging data for business impact.
Provide Talking Points for Interviews
A strong project gives you concrete examples to discuss during interviews. Instead of abstract answers, you can refer to your project: “In my sales analysis project, I identified X trend, which led to Y insight.” This makes your answers more compelling and memorable. For more on mastering Excel for data analysis, check out our guide on Mastering Excel for Data Analysis.
Key Excel Skills for Data Analysis Projects
To create impactful data analysis projects Excel job applications, focus on mastering these core Excel functionalities:
1. Data Cleaning and Preparation
Real-world data is rarely clean. Showcase your ability to:
- **Remove duplicates:** Use “Remove Duplicates” feature.
- **Handle missing values:** Use `IFERROR`, `ISBLANK`, or `NA()` functions.
- **Format data:** Ensure consistent date formats, text capitalization, and number types.
- **Text functions:** Use `LEFT`, `RIGHT`, `MID`, `LEN`, `FIND`, `REPLACE`, `CONCATENATE` (or `&`) to manipulate text strings.
- **Data Validation:** Set rules to ensure data entry consistency.
Clean data is the foundation of reliable analysis.
2. Data Manipulation and Calculation
Demonstrate your ability to extract insights using formulas and functions:
- **Logical functions:** `IF`, `AND`, `OR`, `NOT` for conditional logic.
- **Lookup functions:** `VLOOKUP`, `HLOOKUP`, `INDEX MATCH` (more robust), `XLOOKUP` (modern Excel) for retrieving data.
- **Statistical functions:** `AVERAGE`, `MEDIAN`, `MODE`, `STDEV`, `COUNTIF`/`COUNTIFS`, `SUMIF`/`SUMIFS` for aggregation and conditional counting/summing.
- **Date & Time functions:** `TODAY`, `NOW`, `DATEDIF`, `YEAR`, `MONTH`, `DAY` for time-based analysis.
- **PivotTables:** Essential for summarizing large datasets, identifying trends, and creating dynamic reports.
These functions are the workhorses of Data Analysis Projects Excel.
3. Data Visualization
Presenting your findings clearly is as important as the analysis itself. Showcase your skills in:
- **Charts:** Choose appropriate chart types (bar, line, pie, scatter) to represent data effectively.
- **Conditional Formatting:** Highlight trends, outliers, or key data points visually.
- **Sparklines:** Mini-charts within cells to show trends at a glance.
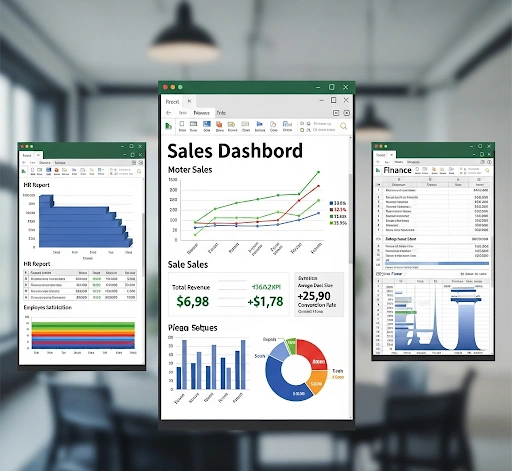
- **Dashboards:** Combine multiple charts, tables, and KPIs into an interactive summary.
Effective data visualization makes your data analysis projects Excel job applications stand out.

Real-Life Excel Data Analysis Examples for Job Applications
Here are practical Data Analysis Projects Excel you can adapt for your job application portfolio:
1. Sales Performance Analysis
**Project Idea:** Analyze a dataset of sales transactions (e.g., from a retail store, e-commerce site).
- **Skills Demonstrated:** Data cleaning (handling inconsistent product names), PivotTables (sales by region, product, month), conditional formatting (top/bottom performers), line charts (sales trends over time), bar charts (sales by product category).
- **Insights:** Identify top-selling products, seasonal trends, underperforming regions, or impact of promotions.
2. Customer Feedback Analysis
**Project Idea:** Analyze customer survey responses or online reviews.
- **Skills Demonstrated:** Text functions (extracting keywords from comments), `COUNTIF`/`COUNTIFS` (counting sentiment/themes), data validation (standardizing responses), pie charts (sentiment distribution), bar charts (common issues).
- **Insights:** Identify common customer pain points, areas for product improvement, or positive feedback themes.
3. HR Data Analysis (Employee Attrition)
**Project Idea:** Analyze anonymized employee data to understand attrition rates.
- **Skills Demonstrated:** `DATEDIF` (calculating tenure), PivotTables (attrition by department, manager, tenure), conditional formatting (highlighting high-attrition teams), bar charts (reasons for leaving).
- **Insights:** Pinpoint departments with high turnover, identify common reasons for leaving, or correlate attrition with tenure.
4. Budget vs. Actual Analysis
**Project Idea:** Compare budgeted expenses or revenues against actual figures.
- **Skills Demonstrated:** Basic arithmetic operations, `SUMIF`/`SUMIFS`, conditional formatting (variance highlighting), variance charts (showing differences between budget and actual).
- **Insights:** Identify budget overruns/underruns, areas of financial efficiency/inefficiency, or unexpected cost drivers.

Comparison: Excel vs. Specialized Data Tools for Job Applications
While Excel is a powerful starting point, it’s useful to understand its place relative to other tools when presenting data analysis projects Excel job applications.
| Aspect | Excel for Projects | Python/R for Projects | Tableau/Power BI for Projects |
|---|---|---|---|
| Accessibility/Learning Curve | Very High (widely used, relatively easy to start). | Moderate to High (requires coding knowledge). | Moderate (drag-and-drop, but specific software). |
| Data Volume Handling | Limited (struggles with very large datasets). | Excellent (handles massive datasets efficiently). | Good (designed for large datasets, often connects to databases). |
| Depth of Analysis | Good for descriptive/diagnostic analysis. Limited for advanced statistical modeling. | Excellent for all types, including predictive/prescriptive. | Excellent for visualization, good for some analytics. |
| Presentation | Effective charts/dashboards within Excel. | Code-based visualizations, often exported. | Industry-leading interactive dashboards. |
| Job Relevance | Highly relevant for most business/admin roles. | Relevant for data scientist/analyst roles. | Relevant for business intelligence/analyst roles. |
For many entry-level to mid-level roles, demonstrating proficiency with data analysis projects Excel job applications is highly effective and often sufficient.
Common Mistakes in Presenting Excel Data Analysis Projects
Even a great Data Analysis Projects Excel can fall flat if presented poorly. When showcasing Excel-based data analysis projects, clarity and structure are essential to make your work impactful. Avoid these common mistakes that often undermine otherwise strong data analysis projects using Excel.
- Messy or Unorganized Workbook: A disorganized Excel file with unclear sheets, unlabelled data, or inconsistent formatting reflects poorly on your attention to detail.
- Lack of Clear Problem/Question: A project without a defined objective or question to answer feels aimless. Always start with “What problem am I trying to solve?”
- Just Showing Charts, No Insights: Visualizations are great, but they need context. Explain *what* the charts mean and *why* it’s important. What are the key takeaways?
- Over-Complicating the Analysis: Don’t use complex formulas just for the sake of it. Choose the simplest, most effective way to get to the insight.
- Poor Data Visualization: Using inappropriate chart types, cluttered visuals, or hard-to-read colors. Charts should simplify, not confuse.
- Not Tailoring to the Job: Presenting a generic project when you could tailor it to the industry or type of data relevant to the job you’re applying for.
- No “So What?”: Failing to articulate the business implications or recommendations based on your findings. Data analysis is about driving action.
Expert Tips and Best Practices for Impactful Data Analysis Projects Excel Job Applications
To make your Data Analysis Projects Excel stand out on job applications, integrate these expert tips. Applying proven strategies to Excel-based data analysis projects helps highlight your technical skills, while refining data analysis projects using Excel can make your portfolio more appealing to potential employers.
1. Choose Relevant and Accessible Data
Select a dataset that is publicly available (e.g., government data, Kaggle datasets, open-source project data) and relevant to the industry or roles you’re targeting. This ensures you can share the project easily and it resonates with recruiters. Look for datasets that allow for interesting Data Analysis Projects Excel.
2. Define a Clear Problem Statement or Question
Before you start, clearly articulate what problem you’re trying to solve or what question you’re trying to answer with the data. This approach is essential for Data Analysis Projects Excel, as it provides focus and ensures your work stays relevant. Defining the scope early also makes Excel-based data analysis projects easier to follow and helps anyone reviewing your data analysis projects using Excel quickly understand the purpose. “A well-defined problem is half the solution.”
3. Document Your Process
Create a separate “Read Me” sheet in your Excel workbook or a short accompanying document. Explain:
- The data source and its context.
- Any data cleaning steps you performed.
- The key formulas and functions you used.
- Your findings and insights.
- Potential recommendations based on your analysis.
This demonstrates your analytical thinking and attention to detail, making your data analysis projects Excel job applications more professional.
4. Focus on Storytelling with Data
Don’t just present numbers; tell a story. Guide the viewer through your analysis, from the initial question to the final insights and recommendations. Use clear headings, concise text, and impactful visualizations to convey your narrative. This is crucial for making your Data Analysis Projects Excel memorable.
5. Practice Explaining Your Project
Be prepared to discuss your Data Analysis Projects Excel in detail during interviews. Practice explaining your methodology, challenges faced, and insights gained from these Excel-based data analysis projects, as well as how your findings could impact a business. Highlighting real examples from data analysis projects using Excel demonstrates confidence and a strong understanding of your work.

FAQ Section
Q: Where can I find datasets for data analysis projects Excel job applications?
A: You can find public datasets on platforms like Kaggle, government data portals (e.g., data.gov, data.gov.uk), Google Dataset Search, or even by extracting data from public websites (with permission and ethical considerations). Look for datasets relevant to industries that interest you.
Q: How many projects should I include in my portfolio?
A: Quality over quantity. 2-3 well-executed and clearly explained projects are generally more impactful than many mediocre ones. Focus on projects that showcase a range of your Excel data analysis skills and analytical thinking.
Q: Should I share the actual Excel file?
A: It depends. For initial applications, a clear summary document (PDF) with screenshots and key insights is often sufficient. For interviews, be prepared to share the actual Excel file (e.g., via cloud link) if requested, ensuring it’s clean and well-organized. Always ensure data privacy if using real-world data.
Q: Can I use publicly available Excel data analysis examples as my project?
A: You can use publicly available datasets, but ensure your analysis is original and provides unique insights. Don’t just copy someone else’s work. The goal is to demonstrate *your* skills, not just familiarity with an example.
Q: How do I explain my project in an interview?
A: Use the STAR method (Situation, Task, Action, Result). Describe the problem (Situation), your role (Task), the Excel functions/analysis you performed (Action), and the insights/impact (Result). Focus on the “why” and “so what” of your findings.
Q: Is Excel still relevant for data analysis in 2025?
A: Absolutely. While specialized tools exist, Excel remains ubiquitous in business. Strong Excel data analysis skills are highly valued, especially for roles requiring practical data manipulation, reporting, and dashboarding. It’s often the foundational tool that leads to learning more advanced platforms. Microsoft continues to update Excel with new features, making it a powerful tool for data analysis.
Q: How can I ensure my project is unique?
A: Focus on a niche problem, combine multiple datasets, or apply a unique analytical approach. Even with common datasets, your interpretation and the insights you derive can make your project unique. The more personal and insightful, the better for your data analysis projects Excel job applications.
Conclusion
In today’s data-driven world, showcasing your analytical capabilities is paramount for career advancement. By creating impactful data analysis projects Excel job applications, you provide tangible proof of your skills, demonstrate problem-solving abilities, and effectively differentiate yourself from other candidates. Mastering Excel’s data cleaning, manipulation, and visualization features is crucial for success.
To continue your journey into cloud security, consider the in-depth resources from the Cloud Security Alliance (CSA), a leading authority on cloud best practices. For more hands-on guides, check out our other posts on building a secure digital toolkit.
